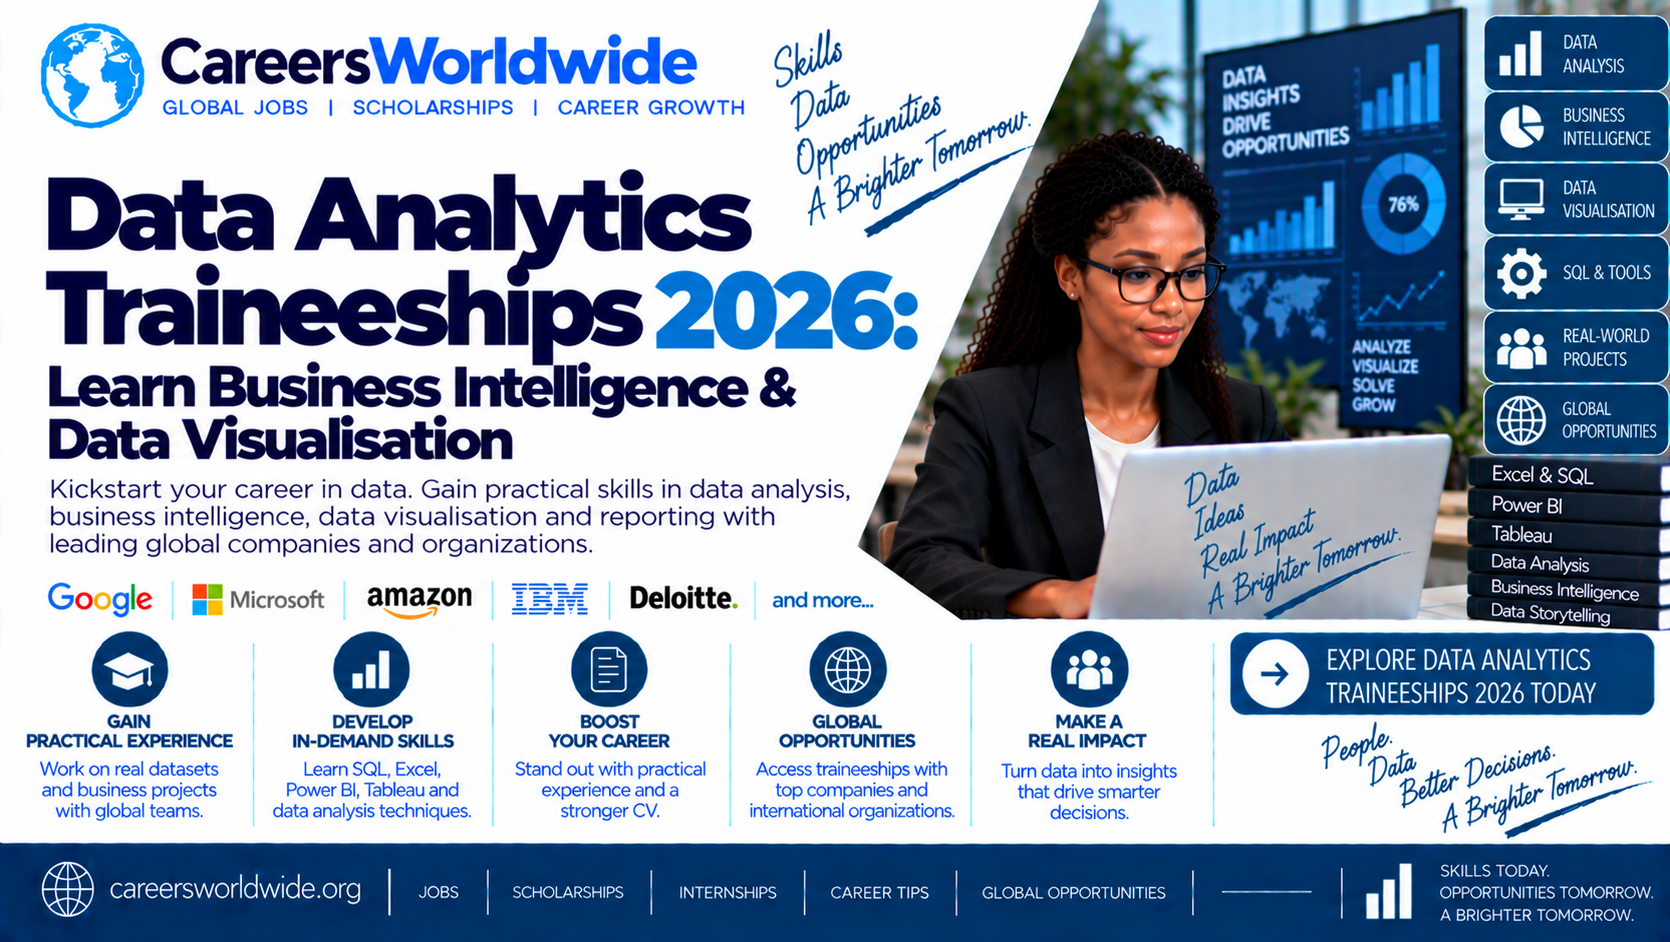

A practical career guide to entry-level data analytics training, business intelligence, dashboards, and data-driven decision-making.
Excerpt: Data analytics traineeships in 2026 can help aspiring professionals build practical skills in business intelligence, data visualisation, reporting, and decision support. Trainees may learn to work with spreadsheets, SQL databases, dashboards, and business data while supporting teams that use evidence to guide decisions. Explore common trainee roles, essential skills, qualifications, portfolio projects, application tips, interview preparation, and official learning and recruitment resources.
Introduction: Why Data Analytics Traineeships Matter
Organizations generate large amounts of information through sales, customer interactions, financial transactions, operations, digital platforms, and public services. But data becomes useful only when people can organize it, interpret it, and communicate what it means.
That is the work of data analytics.
Data analytics traineeships offer an entry point for people who want to learn how organizations turn raw information into reports, dashboards, and practical insights. Depending on the employer, a trainee may support data cleaning, spreadsheet analysis, business intelligence reporting, visualization, quality checks, or the preparation of recurring performance reports.
These opportunities can appear in banks, technology companies, consulting firms, retailers, telecommunications providers, NGOs, healthcare organizations, and public institutions. Some are formal graduate programmes, while others are internships, apprenticeships, or junior roles that include structured learning.
This guide explains how to explore data analytics traineeships in 2026, what skills to develop, how to create a portfolio, and how to prepare a targeted application.
This is a career guide, not a list of verified live vacancies. Always confirm current openings, deadlines, eligibility, compensation, and work arrangements through the employer’s official recruitment website.
1. What Are Data Analytics Traineeships?
A data analytics traineeship is an early-career opportunity that combines practical work with learning and development in data-related tasks.
The exact structure varies. Some programmes provide formal training and mentorship; others place trainees in an analytics or reporting team where they learn through supervised assignments.
Typical activities may include:
- Collecting and organizing data from approved sources.
- Cleaning spreadsheets and checking for missing or inconsistent values.
- Preparing recurring reports.
- Building charts and dashboards.
- Writing basic SQL queries.
- Supporting business intelligence teams.
- Documenting data definitions and reporting processes.
- Checking figures before reports are shared.
- Helping answer operational or business questions with data.
A trainee is not necessarily expected to make major business decisions independently. The role is often about producing accurate analysis, explaining findings clearly, and learning the organization’s tools and processes.
2. Common Data Analytics Trainee Job Titles
Job titles differ across employers, so it is useful to search for related terms rather than relying on one exact phrase.
| Job title | Typical focus |
|---|---|
| Data Analytics Trainee | Supervised analysis, reporting, and data preparation |
| Junior Data Analyst | Entry-level data cleaning, analysis, and insight generation |
| Business Intelligence Trainee | Dashboards, KPI reporting, and business performance analysis |
| Data Visualization Intern | Charts, dashboards, and communicating trends |
| Reporting Analyst Trainee | Recurring reports, data validation, and performance metrics |
| Business Analyst Trainee | Business processes, requirements, and data-supported recommendations |
| Graduate Data Analyst | Graduate-level analytics assignments and training |
| Operations Analyst Intern | Operational metrics, process performance, and reporting |
| Marketing Analytics Intern | Campaign performance, customer behavior, and marketing metrics |
| Finance Data Analyst Trainee | Financial data preparation, reporting, and variance analysis |
Practical tip: Read the responsibilities carefully. A “Business Analyst” position may focus on requirements and process improvement rather than statistical analysis, while a “Reporting Analyst” role may be heavily focused on Excel and recurring reports.
3. Where Data Analytics Trainees Work
Data analytics is used across industries, so traineeships may be found under technology, finance, operations, research, or business teams.
Banks and financial services
Banks use data to monitor transactions, understand customer activity, measure service performance, support risk analysis, and improve operational processes.
Relevant search terms include “graduate data analyst,” “business intelligence trainee,” “risk analytics intern,” and “reporting analyst.”
Technology and software companies
Technology companies may use analytics to understand product usage, customer engagement, subscription activity, service reliability, and business performance.
Trainees may support dashboard development, data quality checks, product metrics, or reporting automation.
Consulting and professional services
Consulting teams use data to support client analysis, process improvement, financial reviews, and business recommendations. Trainees may help clean datasets, prepare visualizations, and organize analytical findings for presentations.
Retail, logistics, and telecommunications
Retailers analyze sales, inventory, pricing, customer trends, and store performance. Logistics teams study delivery times, costs, and operational efficiency. Telecommunications companies may examine network performance, service usage, and customer experience.
NGOs, public health, and research
Nonprofit and public-sector organizations use data to monitor programme performance, assess service delivery, prepare reports, and support research. Relevant titles may include data assistant, monitoring and evaluation trainee, research data assistant, or information management trainee.
Government and public institutions
Public institutions may recruit trainees to support administrative data, planning, reporting, service delivery analysis, and business intelligence. Eligibility and recruitment processes vary by country and institution.
4. What Does a Data Analytics Trainee Do?
The day-to-day responsibilities depend on the team and its maturity. A trainee may work with an experienced analyst, reporting manager, data engineer, or business stakeholder.
Data collection and preparation
Before analysis, datasets often need to be checked and organized. Trainees may combine approved data sources, remove duplicate records, standardize formats, and identify missing values.
For example, a sales dataset might contain inconsistent product names, missing dates, or amounts stored as text. The analyst needs to investigate these issues before drawing conclusions.
Data analysis
Trainees may calculate totals, averages, percentages, trends, and comparisons. They may also help answer practical questions such as:
- Which products contributed most to sales during a given period?
- How did customer activity change month by month?
- Which operational process experienced delays?
- Are there unusual values that require investigation?
- How do results compare with a target or previous period?
The purpose is to answer a defined question, not simply produce charts.
Business intelligence reporting
Business intelligence (BI) involves using data and reporting tools to help organizations understand performance and support decisions.
Trainees may update dashboards, check KPI calculations, prepare recurring reports, and document how figures are defined.
Data visualisation
Data visualization turns information into charts, tables, and dashboards that help readers identify patterns.
A useful visualization should have a clear purpose, an appropriate chart type, readable labels, and enough context to avoid misleading interpretation.
Communicating findings
Analytics work often ends with an explanation. Trainees may prepare a short report or presentation that describes the question, the method, the findings, and any limitations.
A chart alone is rarely enough. Decision-makers need to understand what the numbers mean and what they do not establish.
5. Qualifications and Educational Background
There is no universal qualification for every data analytics traineeship. Requirements depend on the employer, country, programme structure, and technical responsibilities.
Commonly relevant fields include:
- Data Science
- Statistics and Mathematics
- Computer Science
- Information Technology
- Information Systems
- Economics
- Finance and Accounting
- Actuarial Science
- Business Analytics
- Engineering
- Other quantitative or analytical disciplines
Some graduate programmes require a bachelor’s degree and a recent graduation date. Others may accept final-year students, diploma holders, or applicants with relevant practical skills. Some specify minimum grades or particular subjects.
A current or previous example illustrates how requirements can differ: BUSE advertised graduate trainee data science roles in 2026 requiring a relevant bachelor’s degree, recent graduation, and specified technical knowledge. The listed closing date was July 21, 2026, so that particular recruitment period has passed.
jobs.buse.ac.zw
A separate BDO Zimbabwe trainee data analyst advert in 2026 described a 24-month graduate programme and requested a data science or related IT degree, with software development and Python identified as advantages. Its published application deadline was in April 2026.
ApplyNOW
+1
These examples are useful for understanding the kinds of requirements that may appear, but they do not establish current openings.
6. Essential Skills to Develop
You do not need to master every analytics tool before applying. Focus on building a foundation and showing that you can learn, work carefully, and explain your results.
Microsoft Excel or Google Sheets
Learn sorting, filtering, formulas, pivot tables, charts, lookup functions, and data validation. Spreadsheets are useful for cleaning and summarizing structured information.
SQL and database concepts
Practise SELECT, WHERE, GROUP BY, ORDER BY, joins, and aggregate functions. Understand tables, keys, and how data from multiple tables can be combined.
Power BI or Tableau
Learn how to import data, transform it, create relationships, build charts, design dashboards, and explain key metrics. Start with one visualization tool rather than trying to learn all of them at once.
Python or R
These languages can support data cleaning, analysis, automation, and statistical work. Python libraries such as pandas and Matplotlib are useful learning options for data manipulation and visualization.
Analytical thinking and communication
Define the question, check assumptions, distinguish correlation from causation, identify limitations, and explain findings in plain language.
Which skills should you learn first?
A practical beginner sequence is:
- Excel or Sheets for organizing and summarizing data.
- Basic statistics for understanding distributions, averages, and variation.
- SQL for retrieving and combining data.
- Power BI or Tableau for building dashboards.
- Python or R for more advanced analysis and automation, if relevant to your target roles.
The best sequence for you may differ if a particular traineeship specifies a required tool.
7. Business Intelligence and Data Visualisation: What to Learn
Business intelligence and visualization are closely related, but they are not identical.
Business intelligence focuses on turning organizational data into information that supports decisions. Data visualization focuses on communicating information through visual forms such as charts, graphs, and dashboards.
Key concepts
- KPI: A key performance indicator used to monitor a defined objective.
- Dashboard: A collection of visualizations and metrics designed to support monitoring or exploration.
- Data model: The structure and relationships used to organize data for analysis.
- Data quality: The extent to which data is accurate, complete, consistent, and suitable for its intended use.
- Data refresh: The process of updating a report or dataset with newer information.
- Data storytelling: Explaining what the analysis shows, why it matters, and what limitations apply.
Choosing the right chart
| Chart type | Useful for |
|---|---|
| Bar chart | Comparing categories |
| Line chart | Showing change over time |
| Scatter plot | Exploring relationships between two numerical variables |
| Table | Showing exact values or detailed records |
| KPI card | Highlighting a single metric against a target or context |
| Histogram | Exploring the distribution of a numerical variable |
Avoid using a chart simply because it looks attractive. Choose the visualization that helps answer the analytical question accurately.
8. Practical Portfolio Projects for Beginners
A portfolio can help demonstrate your skills when you have limited professional experience. Use public datasets whose terms permit your intended use, or create fictional data.

Project 1: Sales performance dashboard
Use a sample dataset to summarize revenue, order volume, product categories, and monthly trends. Create a dashboard with clear labels and a short written explanation.
Demonstrates: Excel or Power BI, KPI design, visualization.

Project 2: Customer activity analysis
Use fictional or appropriately licensed data to compare customer activity across categories or time periods. Explain the measures used and avoid claiming that the results represent real customers.
Demonstrates: data cleaning, grouping, interpretation.

Project 3: SQL reporting exercise
Create or use a small sample database. Write queries to filter records, join tables, calculate totals, and answer a defined business question.
Demonstrates: SQL fundamentals, structured thinking, documentation.
How to present a project
For each portfolio project, include:
- The question you wanted to answer.
- The dataset source and any usage restrictions.
- The cleaning and validation steps.
- The tools and methods used.
- The main findings.
- Important limitations.
- A dashboard, chart, or sample query.
- What you would improve with more time or data.
A small project with accurate calculations and a clear explanation is more useful than a complex dashboard whose numbers you cannot explain.
9. How to Find Data Analytics Traineeships in 2026
Search across official employer career pages and graduate recruitment portals. Opportunities may be advertised throughout the year, and some programmes recruit well before their start date.
Search phrases
- “Data Analytics Trainee” 2026
- “Graduate Data Analyst” 2026
- “Business Intelligence Trainee”
- “Data Visualization Intern”
- “Graduate Analytics Programme”
- “Junior Reporting Analyst”
- “Data Science Graduate Trainee”
- “Business Analytics Internship”
- “Operations Analytics Trainee”
- “Entry-Level Data Analyst”
Add a country, city, or industry to make results more relevant. If you are applying internationally, check whether the employer accepts applicants who need work authorization or visa sponsorship.
Examples of programme types
In 2026, Babcock’s official graduate careers page described a data analytics graduate programme with rotations, Power BI, statistical analysis, dashboards, and structured development. Its listed application closing date was October 20, 2026, with a programme start in September 2027. Review the official page for any changes to status and eligibility.
Babcock Careers
A graduate trainee programme in Botswana also listed analytics and data science among eligible disciplines, with a bachelor’s degree and no prior experience specified in its published requirements. Its listed date was July 31, 2026; check the original portal for current status.
bsb.mcidirecthire.com
These examples show why applicants should check programme dates carefully: a recruitment page may describe a future intake, a recently closed application, or an opportunity whose status has changed.
10. Official Application and Learning Resources
These resources can help you explore trainee opportunities and build the technical skills commonly associated with analytics. Check the official pages for current programme details and course availability.

Babcock International — Data Analytics Graduates
An official graduate programme page describing analytics work, rotations, dashboards, and professional development.
Explore Babcock’s Data Analytics programme
The page listed a 2026 application deadline and a 2027 start date; verify its current status.
Babcock Careers

Microsoft Learn — Power BI
Use Microsoft’s learning platform to study data preparation, modeling, report creation, and visualization.
Power BI learning paths

Tableau — Official Learning Resources
Explore learning materials for data visualization, dashboards, and Tableau tools.
Tableau learning resources

PostgreSQL — Official Documentation
A reference for learning relational database concepts and SQL, including querying and joining data.
PostgreSQL documentation

BDO Zimbabwe
BDO published graduate trainee data analyst recruitment in 2026. Check its official website for future opportunities and current recruitment instructions.
BDO Zimbabwe official website
The referenced April 2026 recruitment period has passed.
ApplyNOW
+1
11. How to Apply for Data Analytics Traineeships
A strong application connects your skills and experience to the specific responsibilities of the programme.
- Read the vacancy announcementCheck the degree requirements, graduation window, minimum grades, required tools, work location, application deadline, and whether previous experience is required.
- Map your skills to the requirementsMake a short checklist of the tools and competencies requested. Identify evidence from coursework, projects, employment, volunteering, or internships.
- Prepare a targeted CVHighlight analytical projects, Excel, SQL, visualization tools, statistics, communication, and relevant work experience. Describe what you actually did.
- Include a portfolio link if appropriateProvide a concise project repository or portfolio that demonstrates your work. Make sure it contains no confidential information and that links are accessible to recruiters.
- Write a focused cover letterExplain why the programme fits your interests, what relevant skills you bring, and how you approach learning and problem-solving.
- Submit through the official channelComplete the application form, attach requested documents, follow file-format instructions, and submit before the deadline.
- Track your applicationKeep a record of the vacancy link, date submitted, deadline, and any confirmation. Follow up only according to the employer’s instructions.
12. How to Write a Data Analytics Trainee CV
Your CV should show that you can work with information carefully and communicate your findings.
Suggested CV structure
- Name and professional contact details.
- Professional summary.
- Technical and analytical skills.
- Education and relevant coursework.
- Projects and portfolio.
- Work experience, internships, or volunteering.
- Certifications and additional training, if relevant.
- References, if requested.
Example professional summary
Early-career applicant interested in data analytics and business intelligence, with foundational skills in spreadsheet analysis, data visualization, and analytical problem-solving. Eager to develop practical experience in data preparation, reporting, dashboard development, and communicating insights to support evidence-based decisions.
Customize this example to reflect your real skills. If you have not yet used SQL or Power BI, do not list them as proficiencies; you can instead describe them as current learning goals if appropriate.
Example project bullet points
Use only if they accurately describe your work:
- Created a dashboard summarizing monthly trends in a sample dataset.
- Used spreadsheet formulas and validation checks to identify incomplete records.
- Wrote SQL queries to filter, group, and combine sample tables.
- Presented analytical findings in a short report with clearly stated limitations.
- Documented data cleaning steps and explained how key metrics were calculated.
Avoid unsupported claims such as “increased company revenue by 40%” unless you genuinely contributed to a measured result and can substantiate it.
13. Interview Preparation: Questions to Practise
| Interview question | What to demonstrate |
|---|---|
| Why do you want to work in data analytics? | Interest in solving questions with evidence and communicating results |
| How do you handle missing or inconsistent data? | Validation, investigation, documentation, and careful treatment |
| What is the difference between a dashboard and a report? | Understanding of purpose, audience, and level of detail |
| How would you explain a trend to a non-technical manager? | Clear language, relevant context, and limitations |
| What is a SQL join? | Ability to explain how related tables can be combined |
| How do you choose a chart? | Matching the chart to the question and data type |
| Tell us about a project you completed. | Clear explanation of question, method, tools, findings, and limitations |
Practice scenario
A manager asks why sales fell in one month. You receive a dataset containing transaction dates, product categories, order values, and regions.
A structured approach would be:
- Confirm the reporting period and how “sales” is defined.
- Check for missing dates, duplicate records, and inconsistent categories.
- Compare the month with previous periods using the same metric.
- Break down results by product and region.
- Check whether changes in volume, average order value, or data completeness may explain the difference.
- Present the findings and note what additional information would be needed before making causal claims.
This demonstrates analytical reasoning without jumping to conclusions.
14. Salary, Contracts, and Work Arrangements
Traineeship compensation varies by country, employer, programme, and contract type. Some programmes publish a salary or stipend, while others describe compensation as market-related or provide details during recruitment.
Before applying, check:
- Whether the role is paid and the stated amount.
- Contract duration and programme start date.
- Work location and attendance requirements.
- Eligibility for applicants from your country.
- Work authorization or visa requirements.
- Benefits, insurance, and leave provisions.
- Whether training costs or equipment are covered.
Do not assume that a traineeship is remote or that a salary advertised for one employer applies to another. For example, Babcock’s graduate programme lists locations in the United Kingdom and a stated starting salary, while other programmes may use different arrangements.
Babcock Careers
15. Avoid Recruitment Scams
Data analytics traineeships can attract jobseekers who are eager to gain experience. Verify each opportunity before sharing sensitive information.
Be cautious if a recruiter:
- Requests payment to secure an interview or job offer.
- Uses an unverified email address or website.
- Promises guaranteed employment without a credible selection process.
- Requests passwords, one-time codes, or unnecessary banking information.
- Pressures you to submit documents immediately without a verifiable vacancy.
Use the employer’s official website to confirm the opening and application process.
16. Career Progression After a Data Analytics Traineeship
A traineeship can provide experience that supports several possible career directions. Progression is not automatic and depends on your performance, skills, qualifications, and available roles.
Entry-level experience
Data Analytics Trainee · Reporting Intern · Junior Data Assistant
Developing experience
Data Analyst · BI Analyst · Reporting Analyst · Business Analyst
Specialist pathways
Analytics Consultant · Analytics Engineer · Data Scientist · BI Developer
Illustrative career pathways. Titles and requirements vary by organization.
You may also specialize in marketing analytics, financial analytics, operations analytics, healthcare data, risk analytics, or customer insights. The direction you choose can be shaped by the projects and tools you enjoy using.
17. A Practical 30-Day Preparation Plan
Use this checklist to organize your preparation for data analytics traineeships.
Your preparation checklist
0/12
Week 1: Explore the fieldReview 10 relevant trainee vacanciesIdentify recurring qualifications and toolsChoose two target job titles
Week 2: Build foundationsPractise Excel formulas and pivot tablesLearn basic SQL queriesStudy chart selection and basic statistics
Week 3: Create portfolio evidenceBuild a small dashboard using sample dataDocument cleaning and validation stepsWrite a short summary of your findings
Week 4: Prepare applicationsTailor your CV to a real vacancyPractise analytics interview questionsSubmit suitable applications and track deadlinesReset checklist
18. Summary Table: Data Analytics Traineeships 2026
| Category | Key information |
|---|---|
| Main purpose | Develop practical skills in data analysis, reporting, BI, and visualization |
| Common titles | Data Analytics Trainee, Graduate Data Analyst, BI Trainee, Reporting Analyst Intern |
| Potential employers | Banks, technology firms, consulting companies, retailers, NGOs, public institutions |
| Relevant qualifications | Data Science, IT, Computer Science, Statistics, Economics, Finance, or related fields |
| Core skills | Excel, SQL, data cleaning, visualization, analytical thinking, communication |
| Useful tools | Excel, Power BI, Tableau, SQL, Python or R |
| Portfolio ideas | Sales dashboard, customer activity analysis, SQL reporting exercise |
| Application documents | Tailored CV, cover letter, portfolio, and requested supporting documents |
| Contract types | Graduate programmes, traineeships, internships, and junior positions |
| Compensation | Varies by employer, country, and programme |
| Application approach | Verify official vacancies, meet eligibility requirements, and apply through official channels |
19. Frequently Asked Questions (FAQ)
1. What are data analytics traineeships?
They are early-career opportunities that combine practical analytics work with learning. Trainees may support data cleaning, reporting, dashboard creation, data validation, and business intelligence tasks under supervision.
2. Can beginners apply for data analytics traineeships?
Some programmes are designed for recent graduates or candidates with limited experience. Others require specific qualifications, grades, or technical skills. Read each vacancy carefully before applying.
3. Do I need a degree in Data Science?
Not always. Employers may accept applicants from Computer Science, IT, Statistics, Mathematics, Economics, Finance, Information Systems, or other relevant disciplines. Requirements vary by programme.
4. Is Power BI necessary?
Power BI is useful for many business intelligence and reporting roles, but it is not a universal requirement. Some employers use Tableau, Excel, or other tools. Prioritize the tools named in your target vacancy.
5. Should I learn SQL before Python?
For many beginner business intelligence and reporting roles, learning basic SQL early is useful because it helps you retrieve and combine data. Python or R may be more important for roles involving automation, statistical analysis, or data science. Follow the requirements of your target programme.
6. What portfolio projects can I create?
You can create a sales dashboard, a sample customer activity analysis, or a SQL reporting exercise. Use public datasets with suitable usage terms or fictional data, and explain your methods and limitations.
7. Are data analytics traineeships remote?
Some opportunities may be remote or hybrid, but many graduate programmes require office attendance or specific locations. Check the vacancy for work arrangements and eligibility.
8. How much do data analytics trainees earn?
There is no universal amount. Compensation depends on the employer, country, programme, and contract. Verify the salary or stipend in the official vacancy.
9. Where can I find data analytics traineeships in 2026?
Explore official employer career portals, graduate recruitment pages, and relevant public-sector recruitment sites. Search using related titles such as “Graduate Data Analyst,” “Business Intelligence Trainee,” and “Reporting Analyst Intern.”
10. Are the opportunities mentioned in this article currently open?
Not all of them. Some examples refer to 2026 recruitment periods with deadlines that have passed. This article is a career guide, so verify current status and application dates on the official employer website.
Conclusion
Data analytics traineeships can help aspiring professionals develop practical experience in business intelligence, data visualization, reporting, and evidence-based decision support.
To prepare for opportunities in 2026, build a foundation in spreadsheets and SQL, learn a visualization tool, practise explaining analytical findings, and create a small portfolio that demonstrates your process. Then search for relevant trainee and graduate roles through official recruitment portals, checking each vacancy’s requirements and deadlines.
For CareersWorldwide readers, the next step is to choose a target role, identify the skills it requires, and prepare an application that clearly demonstrates your actual abilities.
Official Application and Learning Resources
- Babcock International — Data Analytics Graduate Programme
- Microsoft Learn — Power BI
- Tableau — Learning Resources
- PostgreSQL — Official Documentation
- BDO Zimbabwe — Official Website
- BUSE — Graduate Trainees Data Science Advert
Disclaimer
This article is for general career information and educational purposes. It is not a recruitment announcement and does not guarantee employment, eligibility, compensation, or selection. Vacancy details, deadlines, requirements, and work arrangements may change. Verify all information through the official employer’s website and follow the instructions in the specific vacancy notice. CareersWorldwide is not affiliated with the organizations mentioned unless expressly stated.
SEO Keywords
Data Analytics Traineeships 2026, Data Analytics Trainee Jobs, Business Intelligence Traineeships, Data Visualization Traineeships, Graduate Data Analyst Jobs 2026, Entry-Level Data Analytics Jobs, Data Science Graduate Traineeships, Business Analytics Internships, Junior Data Analyst Jobs, Power BI Trainee Jobs, SQL Traineeships, Data Reporting Internships, Graduate Analytics Programmes, Data Analytics Careers, BI Analyst Trainee, Data Analyst Internship 2026, Analytics Graduate Programme, Data Analytics Jobs for Graduates, Business Intelligence Careers, Data Analytics Zimbabwe.
ALSO CHECK: Entry-Level Grants Assistant Jobs 2026: Support NGO Funding Applications & Donor ReportingSeptember 21, 2026
Digital Health Implementation Jobs 2026: Support Healthcare Technology ProjectsSeptember 20, 2026
Business Intelligence Internships 2026: Learn Data Visualisation, Reporting & Decision SupportSeptember 20, 2026